
Kroki
by kroki.io
Chart APIs
Added on October 31st, 2026
Checked and working on November 1st, 2026
Visit kroki.io →
What it does
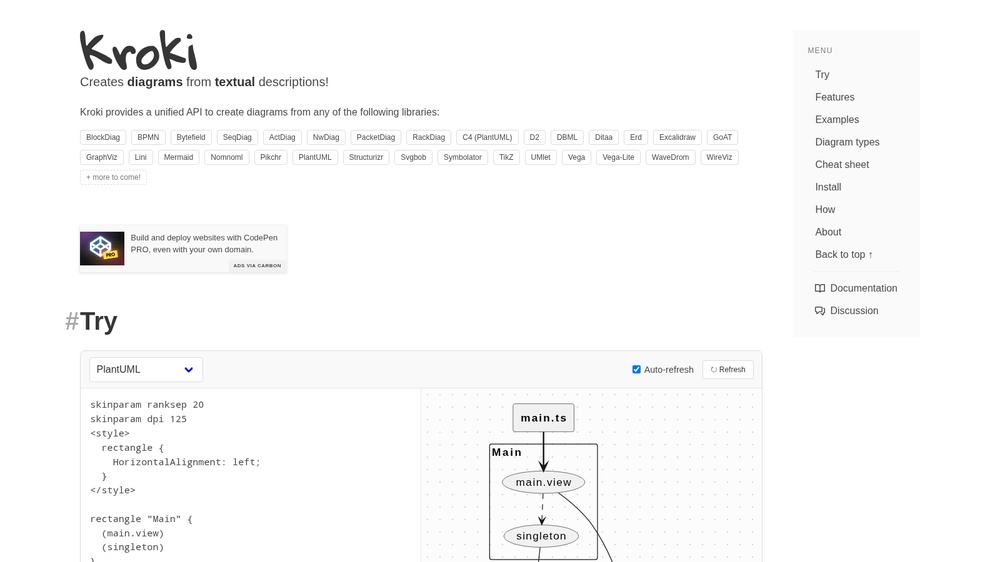
Kroki turns text diagram descriptions into images with one simple API: PlantUML, Mermaid, GraphViz, BPMN, C4, D2, Excalidraw, Vega charts and more than twenty other formats. Send the diagram source by POST, or encoded in the URL for GET, and get back SVG, PNG or PDF. Handy for documentation, wikis and README files. Free public server; open source, so you can also run it yourself.
At a glance
- API key
- Not needed · More APIs with no key
- Pricing
- Free public server; open source, so you can also run it yourself.
- From the browser
- Yes (CORS)
- Interface
- REST, HTTP-GET
- Provider
- kroki.io
- Last checked
- Working on November 1st, 2026
More information: https://kroki.io/
Is this your service? Show that it is listed
Put this badge on your website or in your README; it links to this page. About the badge

Example request
curl
curl 'https://kroki.io/graphviz/svg/eNpLyUwvSizIUHBXqPZIzcnJ17ULzy_KSanlAgB1EAjQ'JavaScript
const response = await fetch("https://kroki.io/graphviz/svg/eNpLyUwvSizIUHBXqPZIzcnJ17ULzy_KSanlAgB1EAjQ");
const text = await response.text();
console.log(text);
Python
import requests

response = requests.get(
    "https://kroki.io/graphviz/svg/eNpLyUwvSizIUHBXqPZIzcnJ17ULzy_KSanlAgB1EAjQ",
    timeout=30,
)
print(response.text)
The JavaScript works in a web page as well as in Node.js 18 or newer.